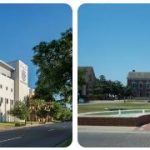
Chapman University School of Law was established in 1995, when the university purchased the former Orange County campus of Western State University College of Law. The move was made to provide students with an alternative to the traditional law school experience that was offered at other universities in Southern California.
The school has since grown to become one of the most respected and well-regarded law schools in the nation. Over its 25 years in operation, Chapman University School of Law has earned numerous accolades from various organizations and publications, including being named “Best Value Law School” by preLaw Magazine for three consecutive years. The school is also ranked among the top 100 law schools in the country according to U.S. News & World Report.
In addition to its academic excellence, Chapman University School of Law is also renowned for its commitment to social justice and public service. The school offers a variety of clinics and externships that give students hands-on opportunities to serve their communities while gaining valuable legal experience. The school also houses a number of centers that focus on specific areas such as immigration law, criminal justice reform, and public interest litigation, among others. Through these initiatives, Chapman University School of Law strives to empower individuals while promoting justice and fairness within our legal system.
Chapman University School of Law is located in the state of California. As one of the leading law programs, Chapman University School of Law has a high average LSAT score of 156-159 when recruiting new students. As a return, the median starting salary for law graduates reaches $75,000 per year. See the following table for detailed admissions information and career profiles of Chapman University School of Law.
Admissions: Chapman University
Chapman University School of Law is one of the leading law schools in the nation. The school has an impressive admissions rate, with an acceptance rate of 67%. The average GPA for incoming students is 3.5, and the median LSAT score is 158. In addition to high academic standards, Chapman also looks for students who demonstrate leadership and commitment to their community. These qualities are reflected in the personal statements that each student must submit as part of their application. In recent years, Chapman has become increasingly selective in its admissions process and now only admits a small percentage of applicants each year. This demonstrates the university’s commitment to admitting only those who have the highest potential for success.
| Fall 2019 Admissions and Enrollment Statistics | |
|---|---|
| Total number of full- and part-time applicants | 2,883 |
| Total number of full- and part-time acceptances | 891 |
| Overall acceptance rate | 30.9% |
| Total number of full- and part-time first-year students enrolled | 181 |
| Number of full-time program applicants | 2,615 |
| Number of full-time program acceptances | 839 |
| Full-time acceptance rate | 32.1% |
| Number of first-year full-time students enrolled | 178 |
| Number of part-time program applicants | 268 |
| Number of part-time program acceptances | 52 |
| Part-time acceptance rate | 19.4% |
| Number of first-year part-time students enrolled | 3 |
| Fall 2019 GPA and LSAT Scores | |
| 25th-75th percentile GPA scores for all students | 3.11-3.56 |
| 25th-75th percentile LSAT scores for all students | 156-159 |
| 25th-75th percentile undergraduate GPA for full-time students | 3.11-3.56 |
| 25th-75th percentile LSAT scores for full-time students | 156-159 |
| 25th-75th percentile undergraduate GPA for part-time students | 2.85-3.82 |
| 25th-75th percentile LSAT scores for part-time students | 151-160 |
Careers: Chapman University
| Bar Statistics (Winter and Summer 2018 administrations) | |
|---|---|
| State where the greatest number of first-time test takers took the bar | CA |
| School’s bar passage rate for first-time test takers | 75.4% |
| Statewide bar passage rate for first-time test takers | 70.7% |
| Class of 2018 Graduates | |
| Total graduates | 184 |
| Graduates employed at graduation | 91.1% |
| Graduates known to be employed nine months after graduation | 96.5% |
| Starting Salaries of 2018 Graduates Employed Full-time | |
| 25th percentile private sector starting salary | $60,000 |
| Median private sector starting salary | $75,000 |
| 75th percentile private sector starting salary | $85,000 |
| Percent in the private sector who reported salary information | 54% |
| Median public service starting salary | $66,500 |
| Areas of Legal Practice (Class of 2018) | |
| Percent employed in academia | 19.6% |
| Percent employed in business and industry | 9.2% |
| Percent employed in government | 10.5% |
| Percent employed in all judicial clerkships | 2.6% |
| Percent employed in law firms | 56.9% |
| Percent employed in public interest | 0.7% |
| Percent employed in an unknown field | 0.7% |
| Percent employed in a judicial clerkship by an Article III federal judge | 2.0% |
| 2018 Graduates Employment Location | |
| Graduates employed in-state | 90% |
| Graduates employed in foreign countries | 0% |
| Number of states where graduates are employed | 12 |
| New England (CT, ME, MA, NH, RI, VT) | 0.0% |
| Middle Atlantic (NY, NJ, PA) | 0.0% |
| East North Central (IL, IN, MI, OH, WI) | 0.0% |
| West North Central (IA, KS, MN, MO, NE, ND, SD) | 0.0% |
| South Atlantic (DE, DC, FL, GA, MD, NC, SC, VA, WV) | 3.9% |
| East South Central (AL, KY, MS, TN) | 0.7% |
| West South Central (AR, LA, OK, TX) | 0.7% |
| Pacific (AK, CA, HI, OR, WA) | 92.1% |
| Mountain (AZ, CO, ID, MT, NV, NM, UT, WY) | 2.6% |
| Employment location unknown | 0.0% |
| Career Services | |
| (Data appear as originally submitted by this school) | |
| Career services operations | The Career Services Office provides comprehensive job search skills training and informational sessions as well as on-campus recruitment and job-posting services. Students and graduates have found employment with a wide range of employers, including top-tier law firms and state and federal courts. |
| Job Type | |
| Bar admission required or anticipated (e.g., attorney and corporate counsel positions, law clerks, judicial clerks) | 77.0% |
| J.D. preferred, law degree enhances position (e.g., corporate contracts administrator, alternative dispute resolution specialist, government regulatory analyst, FBI special agent) | 16.0% |
| Professional/other (jobs that require professional skills or training but for which a J.D. is neither preferred nor particularly applicable; e.g., accountant, teacher, business manager, nurse) | 3.0% |
| Nonprofessional/other (job that does not require any professional skills or training or is taken on a temporary basis and not viewed as part of a career path) | 3.0% |


